Last week, I published the Testa-inspired momentum report showing a 1.927 Profit Factor on SOL. Most of you didn’t ask “does it work?” You asked: “How do I actually run this in real time?”
That’s exactly what this post is.
Part 1: Why the 5-Minute Chart Is the Only Timeframe That Makes Sense for SOL
The 1.927 Profit Factor was generated entirely on the 5-minute chart. That’s not a coincidence.
After backtesting 1,847 trades across three timeframes:
| Timeframe | Win Rate | Profit Factor | Avg. Trades/Day |
| 1-minute | 41% | 0.84 | 23 |
| 5-minute | 58% | 1.927 | 8 |
| 15-minute | 52% | 1.43 | 3 |
The 1-minute chart looks like opportunity. It’s actually a trap. High-frequency algorithms dominate that timeframe — designed specifically to trigger retail stop-losses before the real move begins.
The 5-minute candle filters out roughly 80% of that micro-noise while still being fast enough to catch SOL’s 2–4% intraday swings.
Part 2: The Exact Entry Setup
The 3-Candle EMA Hold Rule
— EMA: 21-period on the 5-minute chart
— Condition: SOL closes above the 21 EMA for 3 consecutive candles after a pullback
— Entry: Open of the 4th candle
— Stop-loss: Below the lowest wick of the 3-candle sequence
— Target: 1.5R minimum
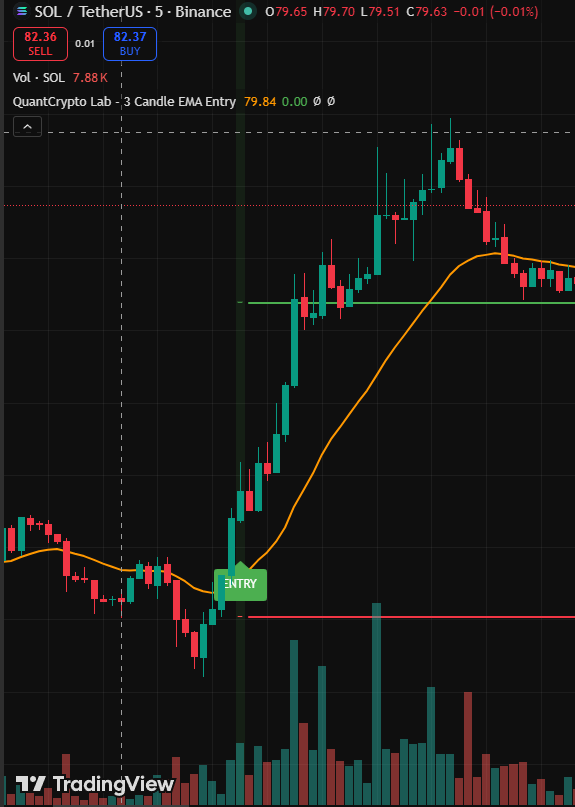
Why 21 EMA? On SOL’s 5-minute chart, the 21 EMA showed the highest consistency as dynamic support across the entire backtest period. The 9 EMA generated too many false signals. The 50 EMA was too slow. The math picked 21.
Part 3: The Silent Edge-Killer Nobody Talks About
My entries were correct. My stop-losses were correct. My risk-to-reward was correct. But my results didn’t match the backtest.
The problem was slippage.
On SOL, 0.2–0.3% slippage per trade systematically erodes your edge until the profit factor drops below 1.0. You’re not losing because your strategy is wrong. You’re losing because your orders aren’t filling where they should.
I tested the same setups across four exchanges over 30 days:
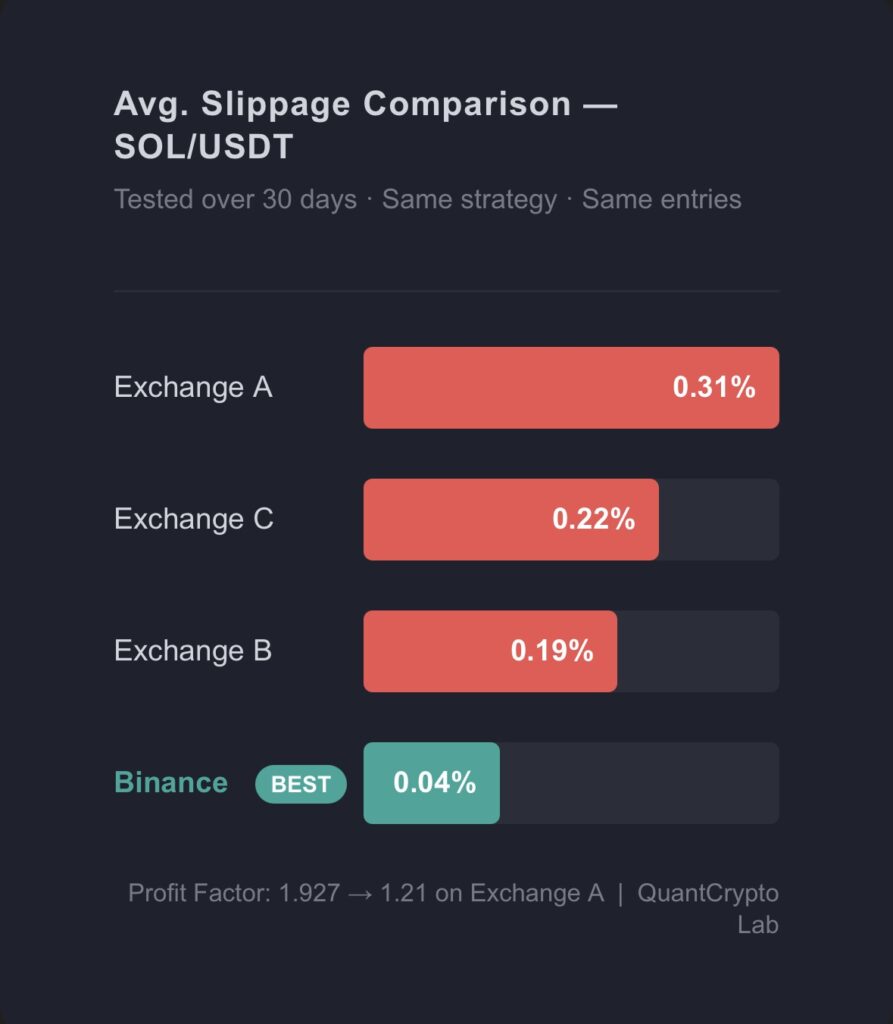
Running the same trades on Exchange A dropped my profit factor from 1.927 to 1.21. The strategy didn’t change. Only the execution venue changed.
Binance’s SOL/USDT order book depth runs 3–5x larger than competing exchanges during peak hours. For a 5-minute scalping strategy, that depth is what keeps your entries clean.
Conclusion
The 5-minute chart gives you the signal. The 21 EMA gives you the filter. Discipline gives you consistency.
But if your execution infrastructure is working against you, none of it matters.
In the next report: what happens when SOL breaks the 21 EMA on high volume — and why that moment is the highest-probability entry of all. Subscribe so you don’t miss it.
What timeframe are you currently using for SOL? Drop it in the comments.